
Casey Watson is the Marketing Communication Specialist for SuiteDynamics. She has a degree in journalism from Murray State University and over 10 years of experience researching and writing about various subjects, including insurance, nonprofit work, and healthcare. She has been writing about NetSuite ERP systems for more than two years.
Exploring the NetSuite Dashboard and Report: How to Get Quick Access to Useful Data
Information is only helpful if it's accessible. A comprehensive NetSuite dashboard puts data at your fingertips.
One of an enterprise resource management (ERP) system’s most important features is its ability to organize and display data. What’s the point in collecting information if there’s no easy way to read and analyze it?
That’s why NetSuite offers users simple, intuitive methods for interacting with data: the dashboard and report. These tools help NetSuite’s 33,000+ customers arrange six petabytes of data and examine it all for better decision-making.
SuiteDynamics works closely with NetSuite to customize and implement ERP platforms. Our experts can tailor NetSuite dashboards and reports for your business so you can get the most from your information. Schedule a consultation with our team today and learn how streamlined your data analysis could become.
Key Takeaways
- Dashboards for Real-Time Data: NetSuite dashboards display real-time business data through customizable portlets and workbooks, helping users easily track performance and make informed decisions.
- Customizable for Different Roles: NetSuite dashboards are flexible, allowing users to add and arrange portlets based on their specific job roles and ensuring they see the data most relevant to them.
- Reports for Deep Insights: While dashboards provide snapshots, NetSuite reports offer in-depth data analysis. These customizable tools let users drill down into business details for better decision-making.
- Reports vs. Analytics: Reports show what happened in your business, while analytics explain why. NetSuite’s SuiteAnalytics provides metrics and insights to understand trends and improve operations.
- Enhanced Decision-Making: NetSuite dashboards and reports simplify data analysis, allowing teams to quickly access information and make critical business decisions, driving efficiency and success.
What Is a NetSuite Dashboard?
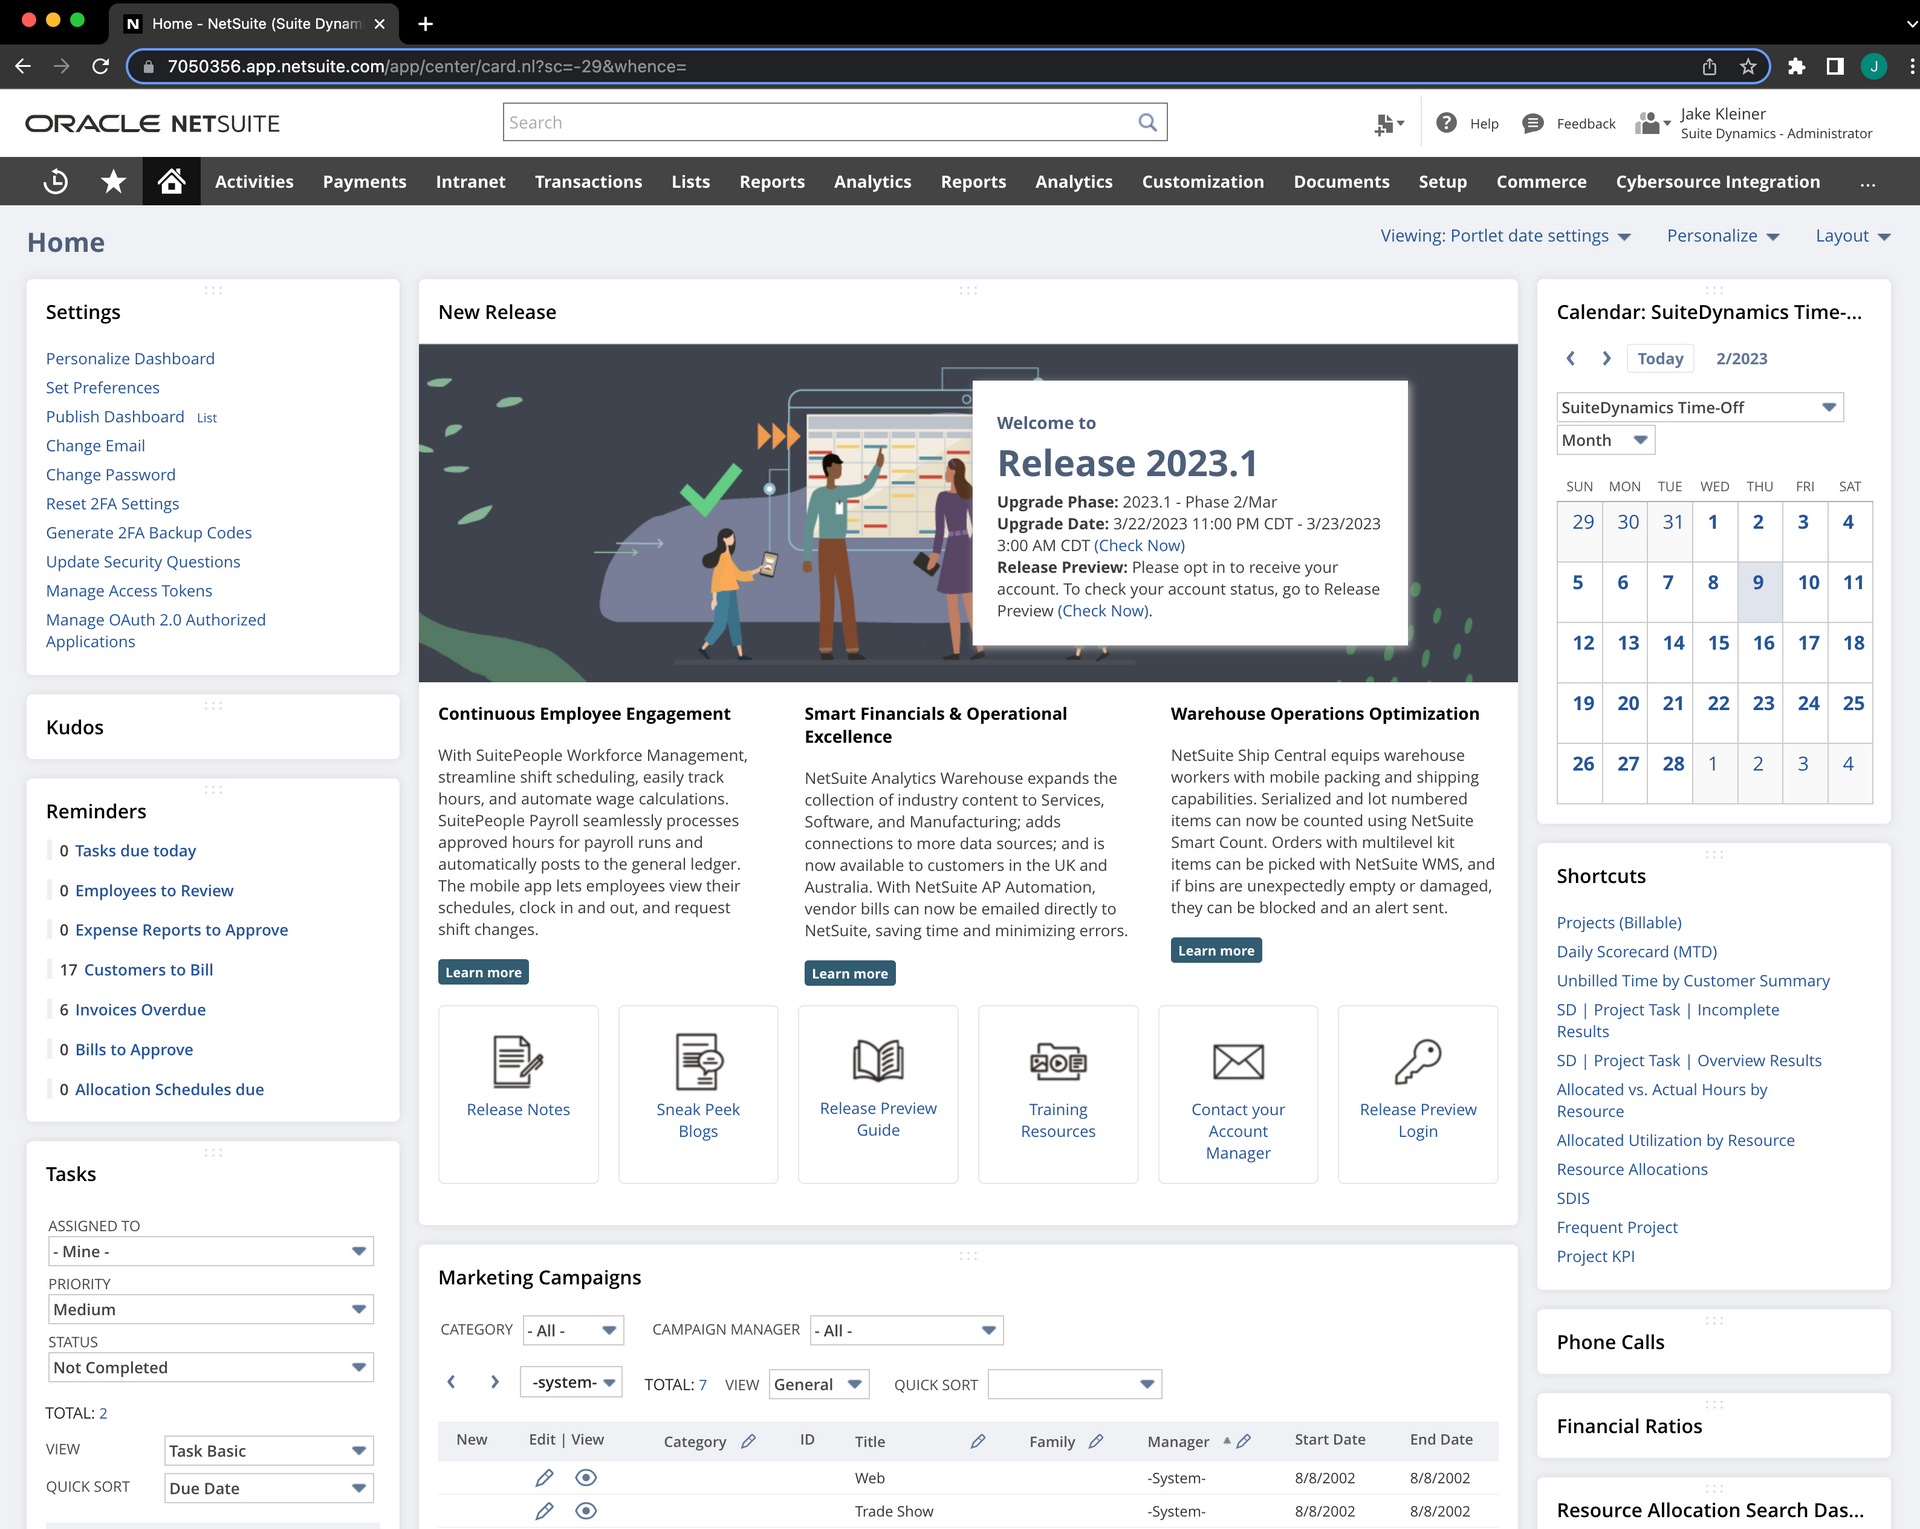
A dashboard is simply a screen inside the NetSuite program that displays frequently used information updated in real time. It often includes features called “portlets” and “workbooks.” Portlets are moveable objects within your dashboard that show business data. You might see some of the following portlets on your dashboard:
- Analytics
- Calendar
- KPI Meter
- KPI Scorecard
- Reminders
- Report Snapshots
- Trend Charts
- Saved Searches
- Tasks
Workbooks also display information but are more interactive and can manage multiple data sets. Think of them more as toolkits that allow you to create, analyze, and share data assets such as reports and charts.

A dashboard is handy because, as a user, you can access it from anywhere and on any device, so you always have the data necessary to make crucial decisions. You can also drill down into any information featured on it, quickly navigating from a summary of yearly transactions to the pertinent details of a single sale.
Andy Morris, NetSuite’s principal product marketing specialist, says these capabilities equip company leaders with critical information for running a successful organization.
“The goal of a dashboard is to help users quickly understand key business information, regardless of their technical capabilities,” he writes in an article for NetSuite. He later adds, “This clear view into relevant business data can help teams track performance, set benchmarks, identify hidden trends, drill down deep into data, make comparisons, and more.”
Basically, it’s the tool a business leader might check ten times per day to guide operations.
Can You Customize a NetSuite Dashboard?
One of a NetSuite dashboard’s best features is its flexibility. Even a mid-sized company employs numerous staff members with various roles and responsibilities; all those workers don’t need to see the same information.
For example, an accounts payable clerk’s dashboard will look fairly different from a warehouse manager’s. The AP clerk may have shortcuts to vendors, purchase orders, and bill payments on their screen, along with a KPI meter for payables. They may also have a vendor portlet showing total purchase orders, the value of total purchase orders, and total open purchase orders.
On the other hand, a warehouse manager may have shortcuts to inventory counts on their dashboard, along with a portlet for monthly inventory trends and another comparing sales orders to customer returns and gross profit average.
NetSuite firmly believes that one size doesn’t fit all. That’s why it offers drag-and-drop dashboard customization. Users can add and subtract items they need and arrange the layouts in any way they wish. Of course, users also need experts like those at SuiteDynamics to create portlets and workbooks featuring specific data sets.
Schedule a consultation with SuiteDynamics experts to explore customized NetSuite dashboards further and discuss how you might want them molded for your organization. Our team will ensure you get the exact data representations you need to chart your company’s success.

What Are NetSuite Reports and Analytics?
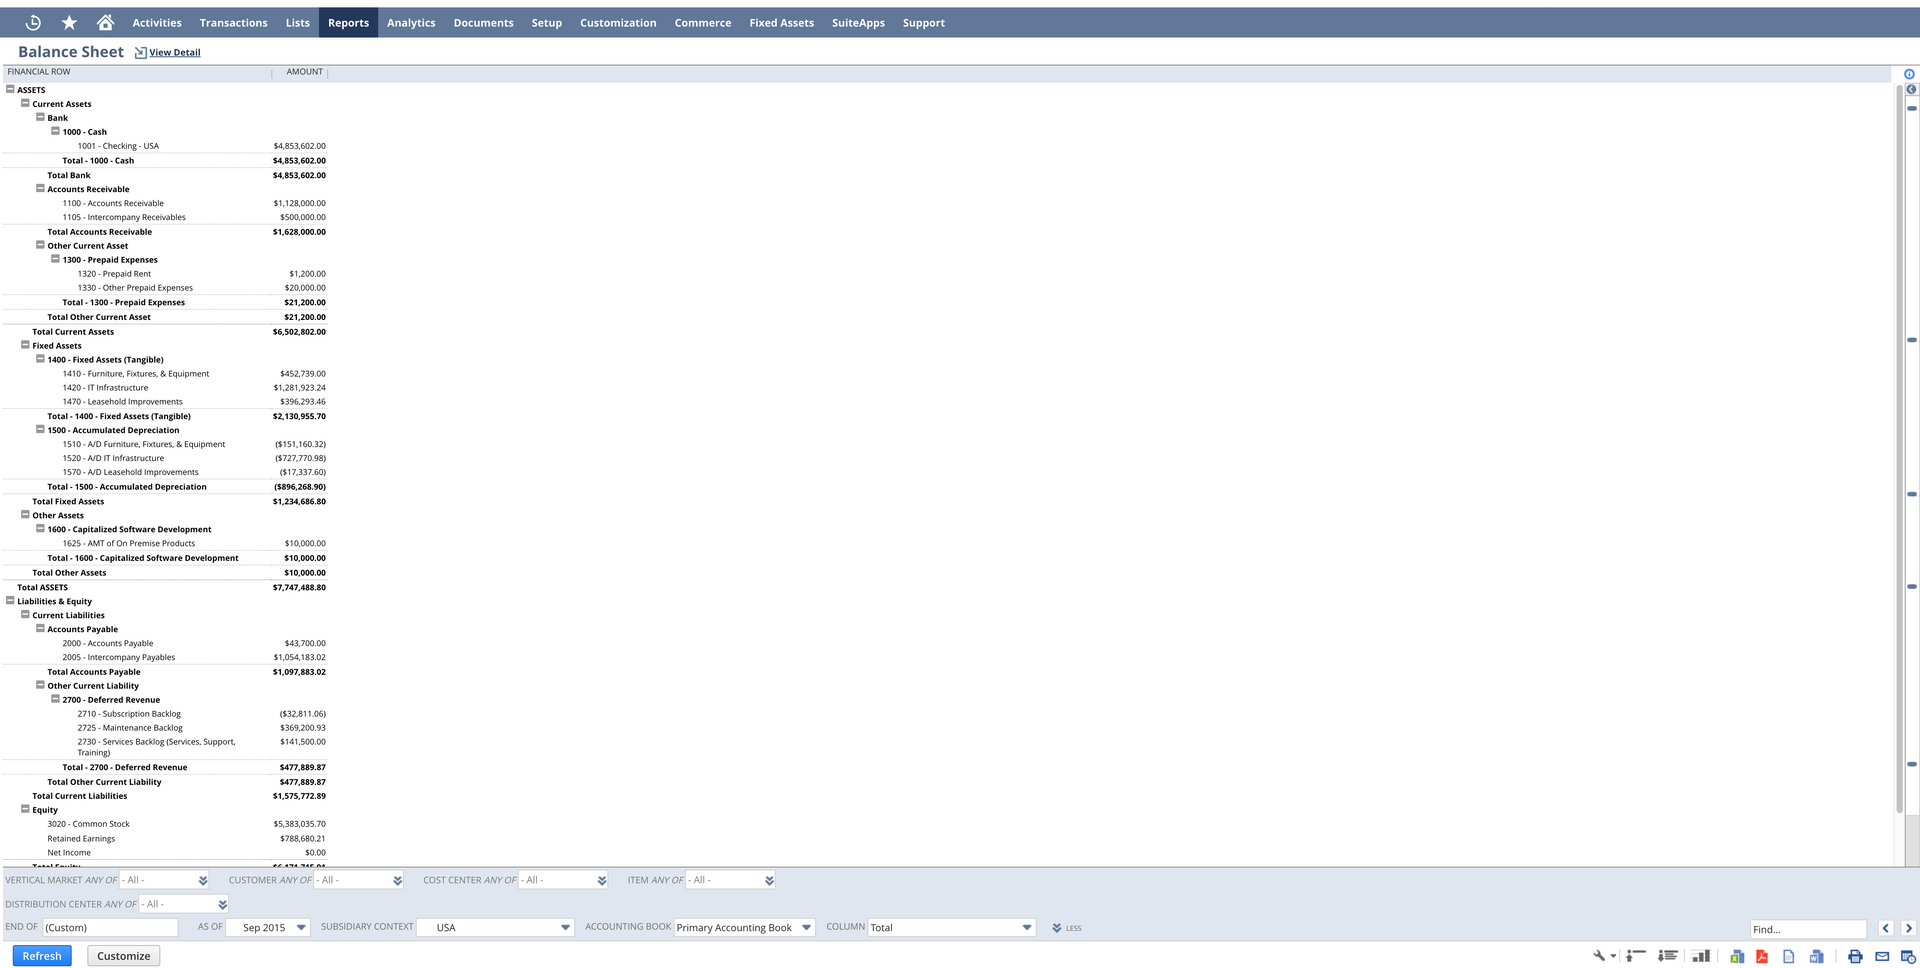
Dashboards may provide snippets of information, but a report dives deep into data. NetSuite offers pre-built reports that help convey info quickly and are customizable to suit your needs. These no-code, industry-standard tools save the hassle of inefficient manual reporting. Plus, just like dashboards, they allow users to drill down into information, revealing minute details about a business.
Many people confuse reporting with analytics, but there’s a significant difference. A report tells you what happened within your business, and analytics explain why. For example, suppose a call center experiences an average of 100 abandoned calls. A report will tell you how many people hung up and how long they waited before doing so.
Yet, you would turn to analytics to find out why this happened. You would look at staffing levels and call volumes and examine when those abandoned calls occurred. This information would help decrease wait times so fewer people would quit their calls.
NetSuite SuiteAnalytics provides well-rounded metrics so you can examine each facet of your company and find ways to improve. It consolidates various spreadsheets into one database so all employees work from the same information. It also offers KPI tracking and workbooks to measure and analyze your performance.
On the other hand, if you’re interested in specific analytics, you can create a saved search and attach it to your dashboard. A saved search creates a real-time results list that offers quick peeks into your business analytics. You can use this feature on essentially any record, so you will always have the information you need at your fingertips.
We know that reports and metrics are some of your company's most important aspects. According to Statista, 87.9% of global firms prioritize data and analytics investment, and yours must do the same if it wants a chance to compete in the marketplace. NetSuite reports allow you to use the information you collect quickly and easily to make the right calls and keep operations moving.
Schedule a consultation with SuiteDynamics experts to see report examples and discover how customizable these tools are to your company. We’ll ensure your team has the data it needs to work at the highest levels of competence.
Make Better, More Informed Business Decisions
Everyone knows that data is integral to a company’s success. It must be thorough, correct, and meticulously organized if your business is going to stay on top of industry and customer trends.
NetSuite dashboard and report capabilities allow organizations like yours to arrange mountains of data into easy-to-understand visual representations. Consequently, your team won’t waste valuable time searching for and analyzing data. Instead, they can find info relevant to their roles quickly and make critical decisions on the spot.
We don’t want your company to spend time collecting data only to store it in an unnavigable database where no one can make sense of it. SuiteDynamics experts can help your team create custom NetSuite dashboards and reports that organize and present information so your business can actually use it. Schedule a consultation today and become a data management powerhouse.
Learn how to create a custom dashboard in our quick tutorial, and increase your NetSuite IQ!
Empower Your Staff with NetSuite
A NetSuite ERP can feel intimidating at first. It’s a massive system with a million moving parts, and it seems impossible to master. But trust us, it’s not.
We know your staff wants to conquer this system, and our SuiteDynamics experts are ready to help you. Our training programs teach everything from loading journal entries via CSV files to customizing dashboards and more.
We know you’ve got the right team to run NetSuite successfully. Let us prove it to you.
Frequently Asked Questions
What security measures are in place to control who can view sensitive financial or operational data on NetSuite dashboards?
NetSuite employs role-based access controls where administrators can precisely define which employees can view specific dashboard elements or reports. This ensures that sensitive financial metrics, HR data, or strategic KPIs are only visible to authorized personnel. Additionally, NetSuite provides audit trails that track who accesses what information and when adding another layer of data governance.
How frequently should companies review and update their NetSuite dashboard configurations?
Most successful NetSuite users follow a quarterly review cycle for their dashboards and reports to capture the most relevant metrics as business conditions evolve. During high-growth phases or significant operational changes, monthly reviews might be necessary. Regular optimization ensures your dashboards continue to provide actionable insights rather than becoming digital wallpaper that teams eventually ignore.

We pull information from NetSuite material, SuiteDynamics experts, and other reliable sources to compose our blog posts and educational pieces. We ensure they are as accurate as possible at the time of writing. However, software evolves quickly, and although we work to maintain these posts, some details may fall out of date. Contact SuiteDynamics experts for the latest information on NetSuite ERP systems.
Disclosure: This article was developed with the assistance of Claude, an AI created by Anthropic. Our editorial team used Claude as a collaborative writing tool, carefully reviewing, editing, and fact-checking all AI-generated content. The final text has been thoroughly vetted to ensure accuracy, clarity, and alignment with SuiteDynamics' editorial standards. We take full responsibility for the content presented in this article, maintaining our commitment to providing reliable and informative insights to our readers.

Get step-by-step instructions for accepting customer payments, making deposits, matching bank data, and completing a bank reconciliation in NetSuite.

Many businesses need complex accounting systems to maintain cash flows. Discover how switching from QuickBooks to NetSuite can create the financial stability you need.

Tired of chaotic physical inventory counts? Explore ten ways NetSuite's Warehouse Management System can optimize your operations and ensure accurate inventory management.

As shipping grows more critical, so does mobile scanning. Discover why this tool will soon become essential for most manufacturing and retail businesses.

Is your NetSuite ERP stuck in the past as your business evolves? Our solution design services keep your system aligned with your changing needs. Discover all you need to know in this guide.

NetSuite ERP customization is complex, but thorough technical documentation can simplify future changes. Learn how it tracks system development, empowers your team, and unlocks your NetSuite investment's full potential.

SuiteDynamics has earned the Winter 2025 Alliance Partner Spotlight Award from Oracle NetSuite for exceptional healthcare software solutions. Learn how we can help you!

Understanding costing methods is essential for any business. This guide provides a quick overview of the different varieties and how they can be used with NetSuite accounting software.

An Oracle NetSuite ERP transforms how businesses operate by unifying their computer systems on a single platform. Learn more about this essential software and how it can serve you!

NetSuite's Global Search is a powerful tool for finding important information. Learn how to make the most of it with these tips and tricks.